- Free Consultation: (212) 897-5410 Tap Here To Call Us

Evolution of Publicly Traded Stock Ownership in the US 1990s-2016
The last few years have seen an improvement in economic activity in the US. After median family net worth remained stagnant between 2010 and 2013, house prices are now rising, corporate equity prices are also on the rise. But how does that translate in terms of traded stock ownership? In order to better understand the present, it helps to take a look at the past.
In his book, Struggle and Survival in Wall Street – The Economics of Competition among Securities Firms, John O. Matthews cites some interesting official statistics: In 1985, 47 million Americans owned stocks and 150 million owned them indirectly. By 1990, 51.4 million owned them directly and nearly 200 million owned them indirectly,
According to a National Bureau of Economic Research paper, by 1995, individuals controlled about two-thirds of outstanding corporate stock.The Federal Reserve’s statistics at the time indicated that households owned less than 50% of outstanding shares, the discrepancy stems from the NBER’s inclusion of a wider variety of financial intermediation options.
The Survey of Consumer Finance 1995 did, however, consider different ways of owning stocks, including mutual funds, retirement accounts, trusts, and other managed investment accounts. Combining these forms of owning stocks with direct ownership, the SCF concluded that stock ownership rose from 37% in 1992 to 41% in 1995. The Federal Reserve’s researchers also found that the increase in stock ownership could be observed in people of all income levels and age groups.
According to research by the Investment Company Institute and the Securities Industry Association, by 1999, equity ownership in America was spiking, “A total of 78.7 million individuals owned equities in early 1999, up 85.6 percent from 42.4 million in 1983.”
The ICI and the SIA also found that approximately half of all US households owned equities near the turn of the century, “An estimated 49.2 million, or 48.2 percent, of all U.S. households owned equities directly or indirectly through stock mutual funds in early 1999.” This represented a major increase from 19% of households in 1983.
But everything that goes up must come down, and according to another Consumer Finance survey by the Federal Reserve, 48.8 percent of Americans held stock either directly or indirectly in 2012. The authors of the survey consider that to be the lowest level since 1995.
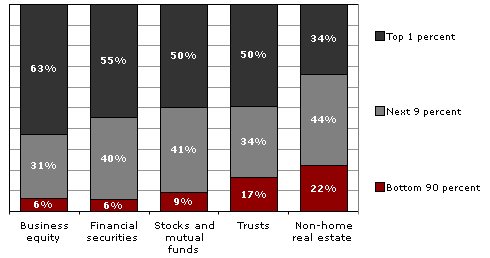
Over the years, the Federal Reserve has also offered some interesting data about the distribution of stock ownership across wealth classes. With the exception of 2010, in the aftermath of the economic crisis, the concentration of ownership has shown a steady increase:
Concentration of stock ownership in the United States, 2001-2010
| Percent of all stock owned | ||||
|---|---|---|---|---|
| Wealth class | 2001 | 2004 | 2007 | 2010 |
| Top 1% | 33.5% | 36.7% | 38.3% | 35.0% |
| Next 19% | 55.8% | 53.9% | 52.8% | 56.6% |
| Bottom 80% | 10.7% | 9.4% | 8.9% | 8.4% |